Ishikawa diagram
1. Objective (Why?)
The Ishikawa diagram is a systematic way of finding causes of occurred or potential problems (effects) in at least five categories.
- The causalities are presented in the form of a fishbone diagram
- Development and visualizationis done by a team of experts under the guidance of a moderator using a whiteboard, flipchart or similar
- The documentation can then take place by using Office tools (MS PowerPoint, Visio, etc.)
- Results of the analysis are measures to solve or avoid the problem
2. Procedure (How?)
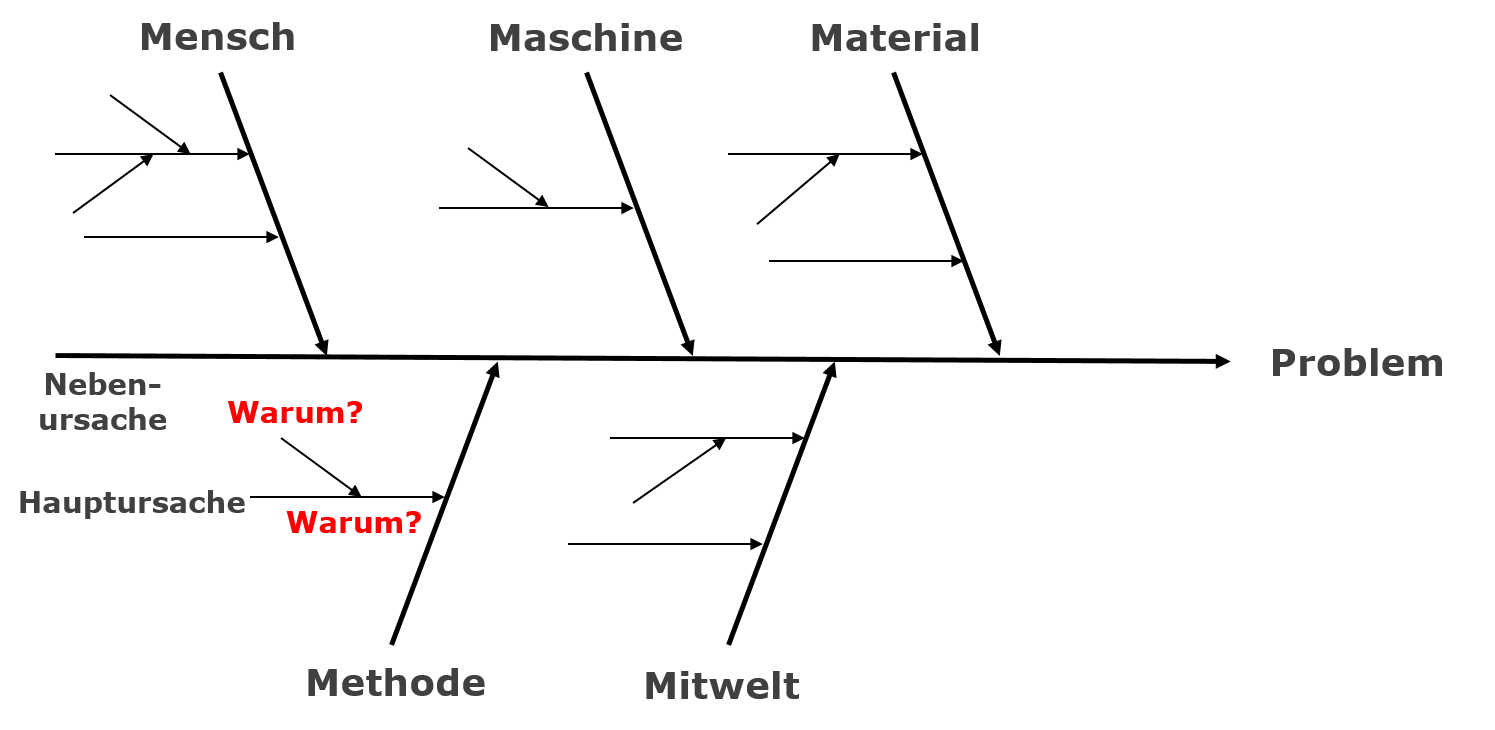
Ishikawa diagram / Fishbone diagram / Cause-effect diagram: Clearly structured representation.
1. Gather a team
- Moderator
- Participants from the fields involved in the issue.
2. Description of the problem
- Content, time, location, extent
3. Determination of the cause categories or „fishbones“. These categories are typically used:
- Material, machine, method, human and ambient conditions
- Other typical categories are: management, measurements and processes
4. Brainstorming – What are the causes? This is the time to guess
5. Assign causes to the previously defined categories
6. Assign subcauses to the categories (ask why up to 5x)
7. Classification / plausibility of the influence of individual causes(for example, through experiments, testing, static analysis) and prioritization
8. Development of measures to correct the problem or of prevention.Evaluation of the measures in terms of quality, cost and time.
Example Ishikawa Diagram Forklift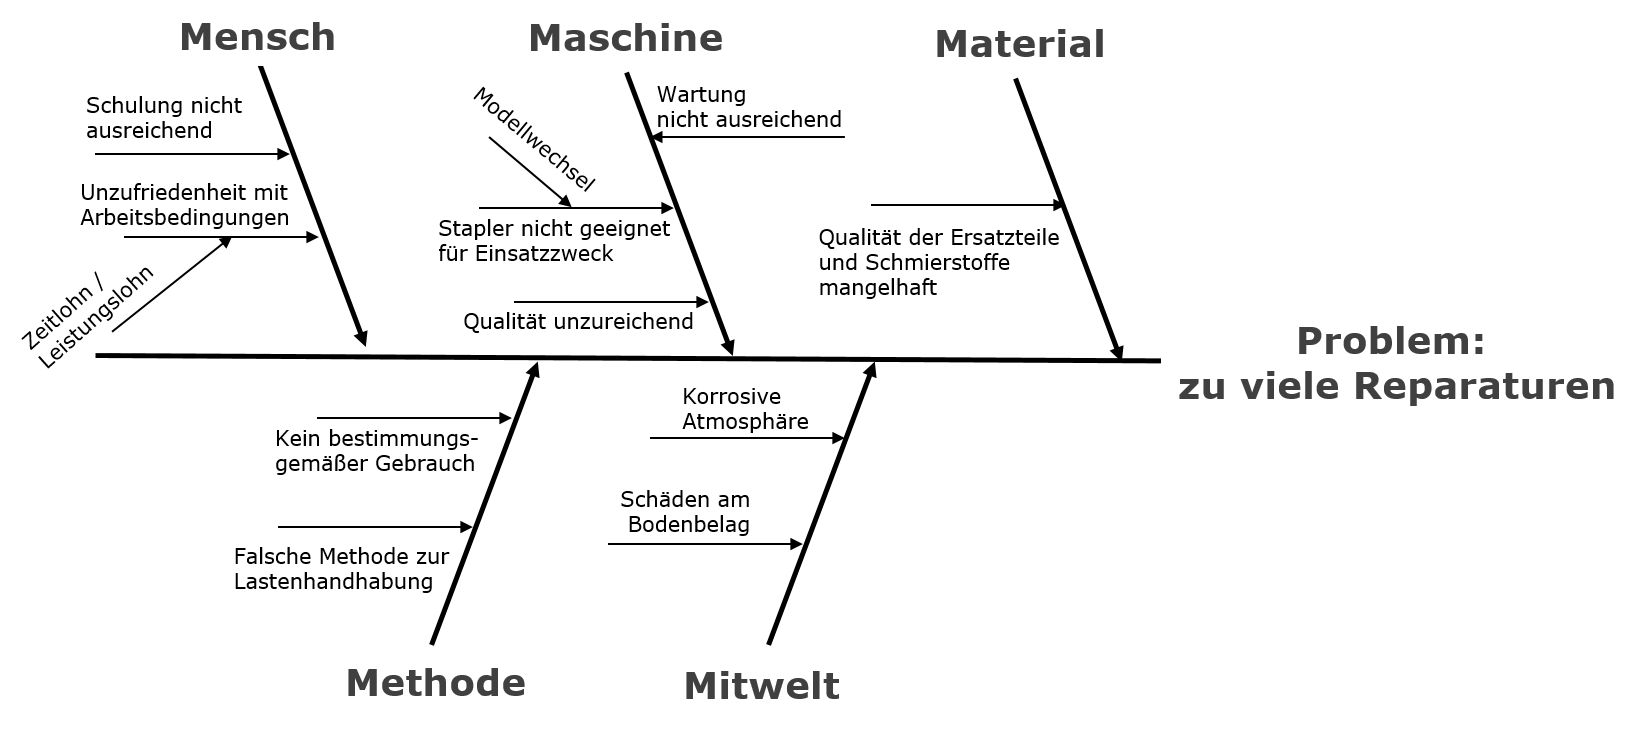
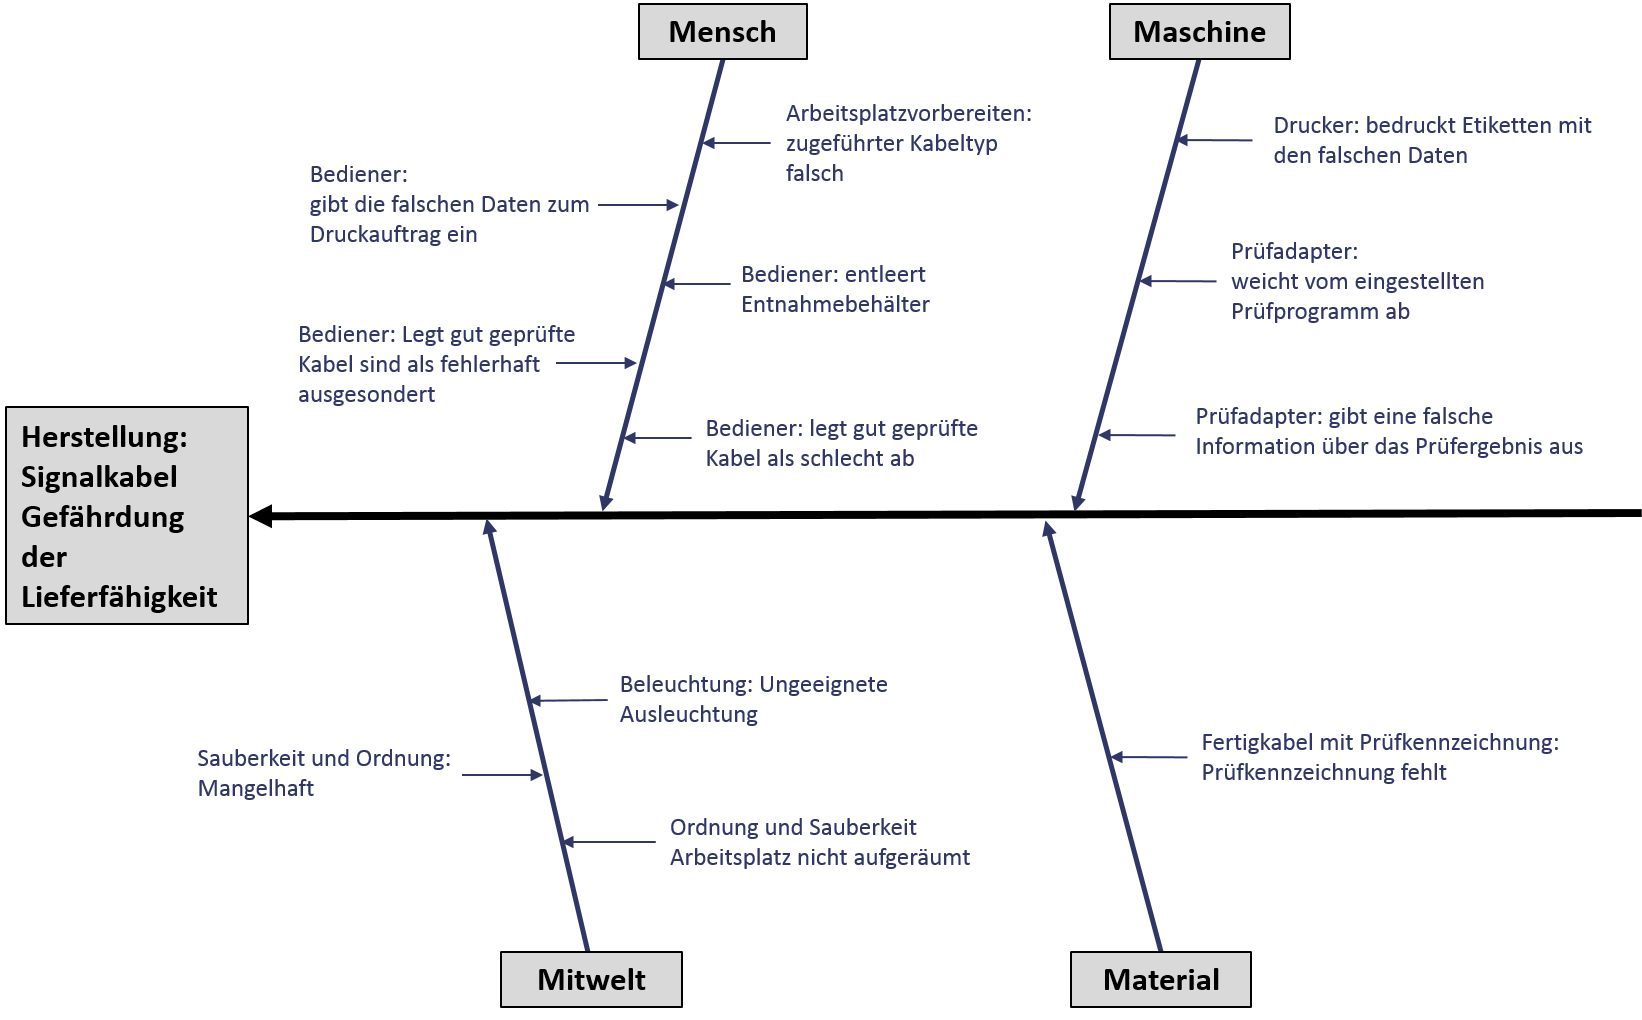
Example: herringbone diagram cable manufacturing