P-Diagram and FMEA – Contradiction or symbiosis?
On March 25, 2020, an FMEA online webinar took place as a substitute for the annual Osnabrück FMEA Forum. During this event, the speakers Winfried Dietz (organizer) and Riccardo Stüber (Schaeffler) gave an in-depth description of the use of “functions”. The tool of the P-Diagram, known from the Ford world, which places the function in the center of the consideration, was given a considerable amount of space. This approach is also used in the harmonized method description of the automotive associations AIAG (USA) and VDA (Germany).
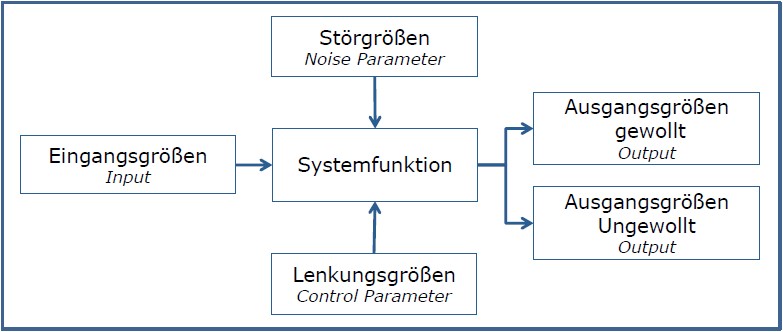
In the P-Diagram, the function is understood as a transformation that generates the desired and undesired output variables from the three inputs: input variable, disturbance variable and control variable.
This approach hasproven to be very effective when the “function” is not evident or needs to be re-described. To use the P-Diagram in connection with an FMEA, it must be clear as to which relationships exist between the P-Diagram and the FMEA structure or FMEA form. However, this is not the case, neither in the literature nor in the current method description. One such indication is that while there are approaches in software to capture P-Diagrams, there is no software available on the market that directly uses a P-Diagram as input to populate the FMEA structure (see also the blog post. So there must be one or more logical breaks.
Analysis
Let's take a closer look at the variables.
Input variables: These are controlled input quantities that lie within a specified tolerance range.
Energy: (momentum, force, torque, kinetic energy, current, voltage, heat flow),
Material flow (material property, concentration, volume flow) Information (motion / change of location, electrical or digital signal, perception) Input variables must be supplied from a lower level in order to reflect the physical sequence of cause and effect.
Disturbance variables: These are variables from the same categories as the input variables, but not controllable, at least not controlled in the described state.Disturbance variables can a rise at two points in time, which are distinguishable in the sequence of cause and effect, which is why they must be handled differently:
a) Disturbance variables that act during the creation/manufacture of the product,
such as the fluctuation of supply parts can be influenced by development (→Purchasing specification) or they can be checked, filtered, sorted or rejected in the process before the supply parts are used (→ Supplier control and incoming goods inspection).
b) Disturbance variables that occur during the use of the product,
such as potential misuse or abuse, will either result in tolerated failure caused by misuse or will be accounted for by requirements. This, for instance,will mean some sort of safety margin for normal use (robust design). One example of this is the design of landing gear components for driving through potholes quickly or jostling at the curb. Both of these are incidents that are not intended, but do happen without being allowed to render a car unroad worthy as a result. Disturbances of typea) are causal for further incidents. →They must therefore be part of the cause level with their categories.Type b) disturbance variables will be requirements of the customer, i.e. specifications or requirements that should be known as a development goal in order to be able to consider them as a target variable. The same applies to aging effects. Aging effects must also be known and taken into account as a requirement in order to keep disturbance variables low over the lifetime in the field.Target variables are results of the transformation, which in turn are available in categories as for input and disturbance variables, but the categories do not have to be the same as from input and disturbance.Example: The function is to represent the speed of a car as the position of a pointer in the display→ input variable is the speed of the output shaft, disturbance variable is the wear-dependent diameter of the car tire and the air pressure in the tire and its temperature, the output variable is represented by an angle on the display scale. This would describe the function of a tachometer in the elements of a P-Diagram.
Control variables:Variables used to intervene in the transformation from a target/actual value comparison to compensate for disturbance variables and to steer the result into an intended target window (tolerance of the result).Control variables are also influences that must always be temporally present before the result; yet result from the process, from the interaction of testing and decision-making. In the design, control variables will steer the development loops, i.e. fine-tune or intervene to correct before the development result is finally passed on. In the process, control variables occur simultaneously or alternately with the process activities and are decisions based on target/actual comparisons.(In the absence of a target/actual value comparison, one cannot speak of steering, but at most of control (= fixed specification of parameters)).
All steering variables are measures, not requirements, specifications or parameters. They should therefore not appear in the function or error network, but should take place in the avoidance, detection and, if necessary, reaction measures (The P-Diagram should not be used to decide at which level these measures should be applied.). For instance, a control parameter could be a correction value determined on the basis of a measurement of tire pressure and outside temperature to render the reading in the speedometer more accurate. All these considerations take into account only the discussion between three levels. If more levels are necessary to show the structure, the P-Diagram can always perform only the functional analysis for the central element of a level.
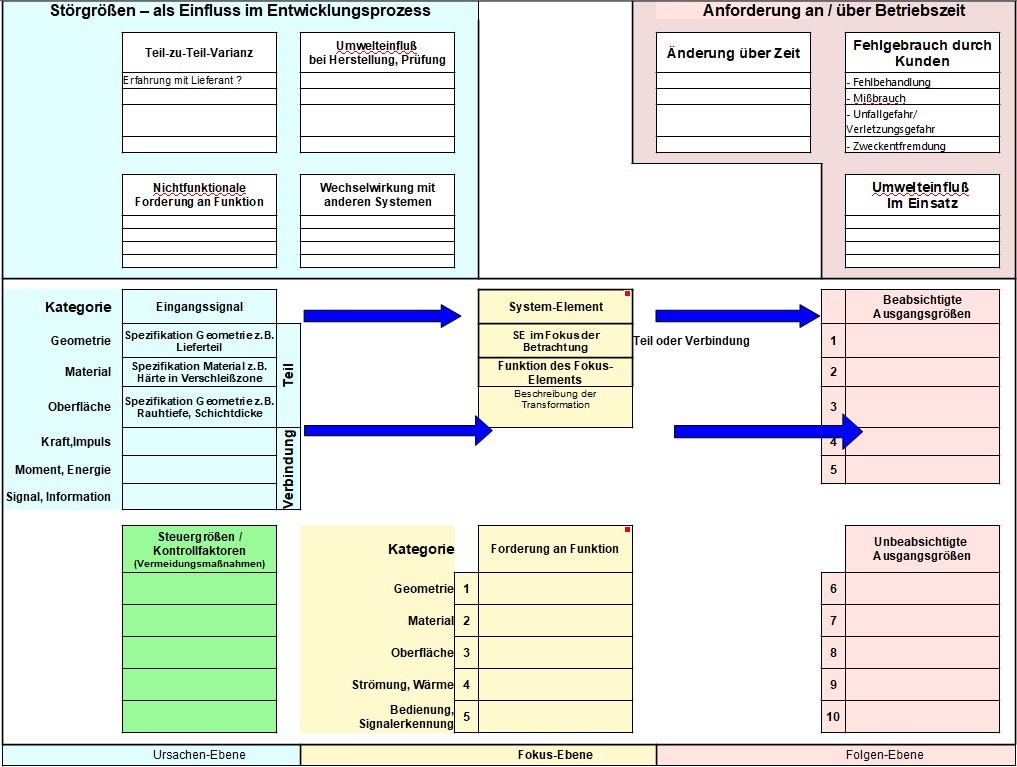
If the simplified form of the P-Diagram is not taken into consideration, but rather a formulated version, e.g. as given in the VDA-AIAG FMEA manual, then functional descriptions and their parameters (= Requirement, specification, parameter value + limits) are listed together. The same would have to be done for the input variables, the disturbance variables and the target variables.
Proposed solution
The P-Diagram and FMEA complement each other if they are two representations of the same content. This can be achieved given a few conditions:
- The input, disturbance and control variables are entries on the cause level.
- The function description in the middle of the P-Diagram is assigned to the focus level. This is detailed by the requirements for the function in order to become evaluable.
- The desired and undesired output variables are the results and correspond to the requirements of the functions at the consequence level. They describe the benefits to the customer.
- In the design, design classes such as geometry, material, surface for physical parts or force, momentum, impulse, energy flow, mass flow, signal for internal connections/interfaces are to be specified at the cause level and filled with their specifications.
- In the process, the 4Ms man, machine (equipment), material and method (environment, process boundary conditions) are primarily prepared as categories at the cause level.
- The disturbance variables would be divided into two groups that a) form categories at the cause level or b) become requirements at the consequence level. In both cases, it appears useful to include the headings as categories.(Based on the software deployed, these can be, for example, designations for the system elements on the cause level or for collective terms in the function network.)
- Control factors would be adopted as avoidance measures that could be assigned to cause-level errors in a later step.
This would align the structures of P-Diagram and FMEA. Types of characteristics / parameters / requirements, to the extent that they differ from the systems, could be created identically in both views by means of preselection.
The last obstacle is still the linkage to a function network. The blocks in the P-Diagram correspond initially only to the list-shaped entries in the three levels of the structure as well as in a measure list. The FMEA form as well as the function network, however, take the assignments of the functions to each other into account. This is where different interpretations of the concept of function come into play. These interpretations can probably all be used in terms of FMEA methodology, but software to support structural, functional and failure analysis requires a clear picture. To this end, it is crucial to know what task is assigned to a system[/tooltip]element, a category, a function, a requirement, a feature, a parameter. What is linked to a function network with what in this concept? What other relationships are indirectly or additionally necessary? At present, the P-Diagram is not designed to create this network of relationships as well.
This means that bidirectional use of the P-Diagram in an FMEA structure would be severely restricted or even impossible, as only the network provides clarity in the relationships between the three levels.
All other aspects would, with this structure, at least be transferable from the P-Diagram to the FMEA structure. This would involve both the design and the process FMEA, since the logic between the levels and system elements would remain identical. Only a differentiation between part and interface would no longer be necessary. The types of system elements employed would also have to adapt to the focus element under consideration.
This would result in a clear link between P-Diagram and FMEA formats. The seemingly contradictory and arbitrary transfers would be transformed into a logical relationship. Both forms of representation can complement each other.
This detailed form, supplemented with additional fields, would make the P-Diagram appear less “compact”, but its structure would be adapted to the three-level scheme of the FMEA.
The question as to whether there is then still a graphical / visual benefit compared to the FMEA structure trees or the FMEA form must be answered from practical application.
Previous discussions have fueled this doubt because, after all, the functional network connections cannot
be made in the P-Diagram, and therefore cannot be transferred to the FMEA, nor can they be returned from the FMEA to the P-Diagram.
Conclusion
The conclusion of this consideration is therefore:
The analogies between input function and output with the three levels of the FMEA can be clarified with an extension or by slight restructuring. Since the function network links, however, have no equivalent in terms of the P-Diagram, there is at least no bidirectional dependency of the two representations within reach. This reduces the usefulness and the need for the user.
There may be a needfor an additional extension step for the P-Diagram, just as the networkrelations are an extension of the form sheet.
Sources:
AIAG-VDA FMEA manual, VDA QMC, Berlin, June 2019
Dietz Consultants
FMEA – Online, Webinar an 03/25/2020