Coupling FMEA with Engineering AI for robust products and stable processes
Productive coupling of Design and Process FMEA with an AI for product and process design using the example of power electronics, sub-process laser welding pins & tabs
1. Challenge / Task (Why?)
FMEAs are mandatory in many areas, e.g., automotive and aviation. They are known to be complex and to expose problems, but not to solve them. With an FMEA, it is clarified which product characteristics are the most important and must be correctly designed so that a product works. However, with products with hundreds of requirements/quality characteristics and even more possible influencing factors, it becomes increasingly difficult to derive the right controls from this. Failure causes and unknown correlations can often only be solved very slowly or not at all with standard engineering procedures. With ever faster product cycles and completely new challenges, such as e-mobility, industrial companies need new solutions to combine sustainable quality management with fast product validation, stable processes, and competitive manufacturing costs.
2. Objective
Demonstrate possibilities to couple the results of a D-FMEA and P-FMEA with the Engineering AI to ensure quality sustainably and minimize manufacturing costs.
3. Procedure (What & How?)
The solution is to use the results of the D- and P-FMEA for the training of an Engineering AI, which calculates how to design the product characteristics and processes, i.e., outputs concrete values for nominals, target values, and best settings. The effort of the FMEA can then be easily justified by the immediate benefit. For an AI system to be used already in product design, it must not rely on large amounts of data (“Big Data”), as these are not yet available in this phase of the product life cycle. The Engineering AI system presented here, which was specifically developed for sustainably robust products and stable processes, works based on 6 - 30 parts in the learning samples. The prerequisite for it to work with few data is the systematic selection of the samples (“Smart Data”). On this basis, it can predict the quality and reliability over the lifetime and calculate the best settings for parameterization and tolerancing of the products, design characteristics, and processes. To identify the right data, the Robust Design method is used, which was further developed from Design for Six Sigma and Lean Six Sigma based on hundreds of engineering projects.
Image 1: Robust Design method and Engineering AI for robust products and stable processes
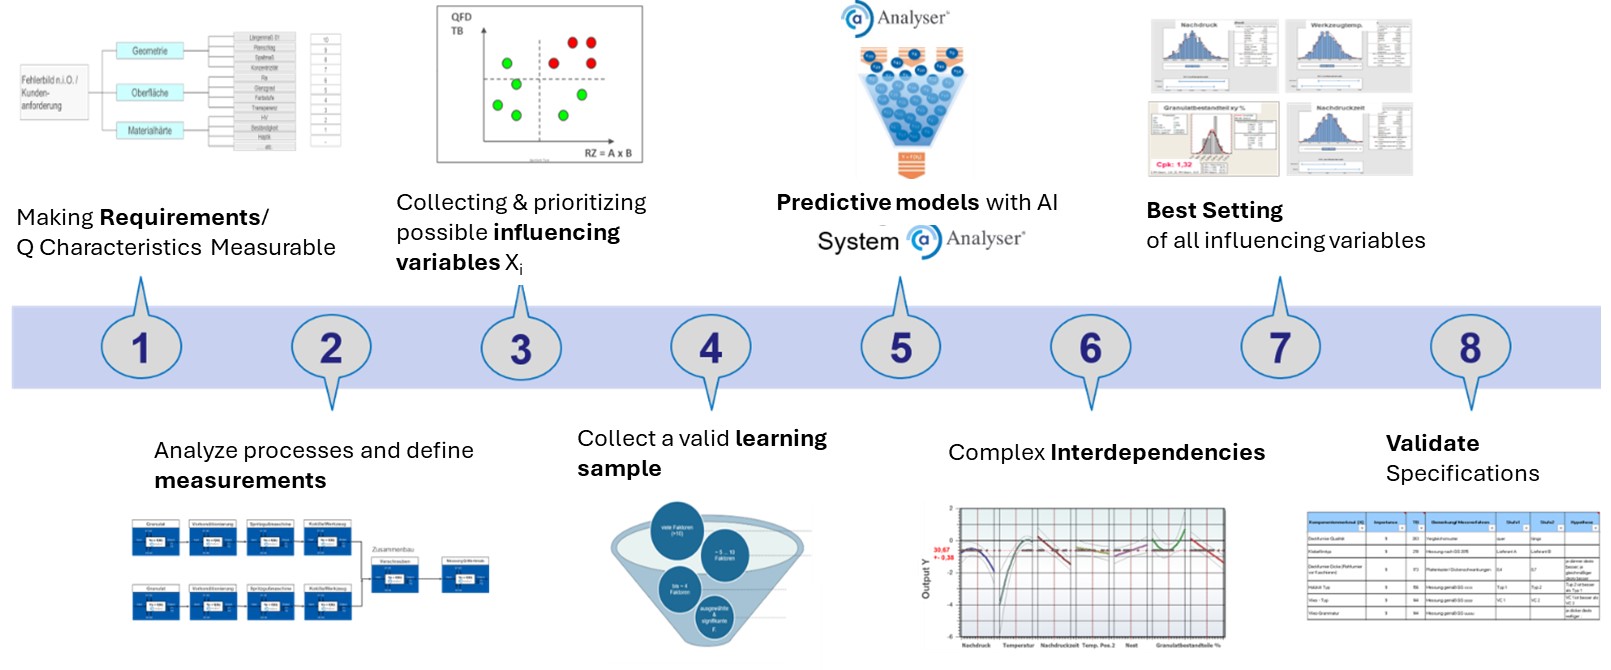
Interaction D-FMEA, P-FMEA and Engineering AI
In step 1, the requirements/quality characteristics are made measurable, in step 2 the measuring locations are determined. The important step 3 then brings the results from the Design FMEA or Process FMEA into play. The D-FMEA shows the degree of current design risk per product characteristics, the P-FMEA per process characteristics (O-value) and provides the risk number, the product of occurrence probability and severity. The risk number is important to prioritize the possible influencing variables in order to measure only the important influencing variables. This is done for product as well as for process characteristics each in a two-dimensional prioritization graph: technical severity over FMEA risk number RN = O x S.
Image 2: Prioritize Q-Characteristics 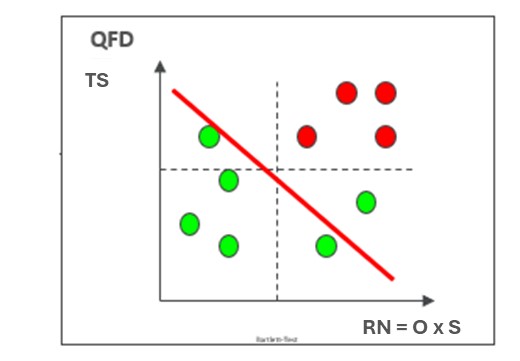
The red bisector in image 2 marks a boundary. Above are the important, probably relevant influencing variables with high technical severity for the quality characteristics and/or with high risk number RN, because they are not robust or difficult to manufacture to tolerance. Below are the influencing variables with low technical severity and low risk number RN, i.e. in the case of a product characteristic they have only a small effect on the Q-characteristics or they are easy to manufacture within their specification limits. On this basis, the influencing variables to be measured (product characteristics or process parameters) for the learning samples (6-30) are selected and fed to the Engineering AI. All influencing variables to the right above the red bisector in image 2 should be measured. Influencing variables below the red line, for which measurement data already exist or which are easy to determine, should be included. For each target size, a representative sample for as large a working window as possible of the distribution of the Q-characteristics to be expected in reality should be collected. Also, disturbance variables, i.e. non-influenceable influencing factors, should be included. For difficult to measure influencing variables and all target sizes, measurement system analyses type II are highly recommended in order to be able to train the Engineering AI system with valid data and values. From step 5, the Engineering AI takes over. It creates valid prediction models, recognizes complex correlations (step 6) and calculates the best settings for the optimal parameterization and tolerancing of all influencing variables in the form of product characteristics (D-FMEA, step 7) or process parameters (P-FMEA, step 7). In step 8, the new nominals or target values determined by the Engineering AI are validated with the respective specifications and tolerance limits in a confirmation lot.
4. Example: Laser Welding
The product design of an inverter from the product family of power electronics including assembly was to be secured and optimized for reliability and life span. In step 6, the Engineering AI had recognized the complex correlations and interactions that existed, for example, between the gap dimension (red) and the danger of welding a hole or the strength of the weld seam (measured by the shear force).
Image 3: Use complex correlations to implement solutions 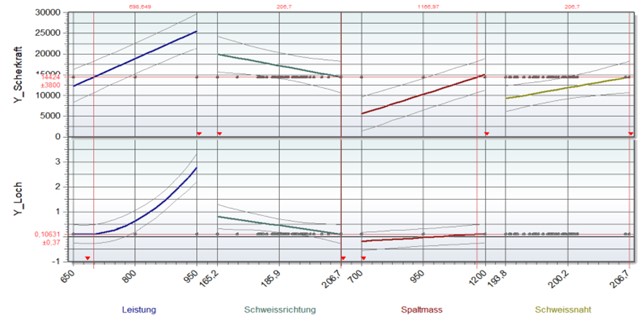
On the basis of multiple, non-linear prediction models, the tolerances could then be opened at the right places without affecting the quality.
Because tight tolerances do not necessarily lead to functionality and quality. The Engineering AI calculated the Best Setting, i.e., the optimal parameterization and tolerancing over 2 levels of influencing variables (Image 4), which were finally validated in a confirmation lot.
Image 4: New nominals including specifications 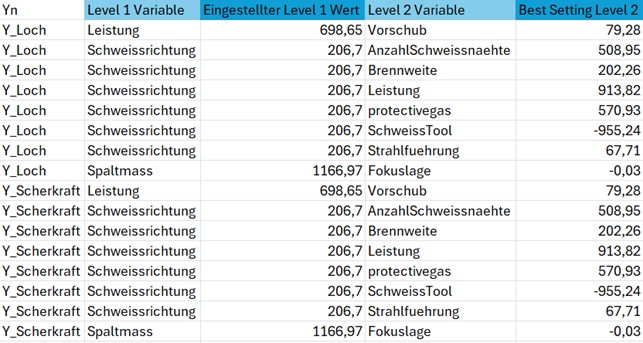
5. Result
Through the use of the Engineering AI, the product design and the entire manufacturing process could already be validated and optimized from the C-sample. This saves nasty surprises shortly before and after the SOP (Start of Production), which often occur in conventionally and without Engineering AI conducted series starts. As a rule, up to 60% of the start-up costs up to SOP and approx. 50% of the time from prototype to SOP are saved. The results of the Engineering AI application are fed back into the D- and P-FMEA (increase in robustness of the products and manufacturing processes) and improve the O- and D-ratings there.
Authors: Frank Thurner & Cordula Mahr, Contech Software & Engineering GmbH, mts Consulting and Engineering GmbH