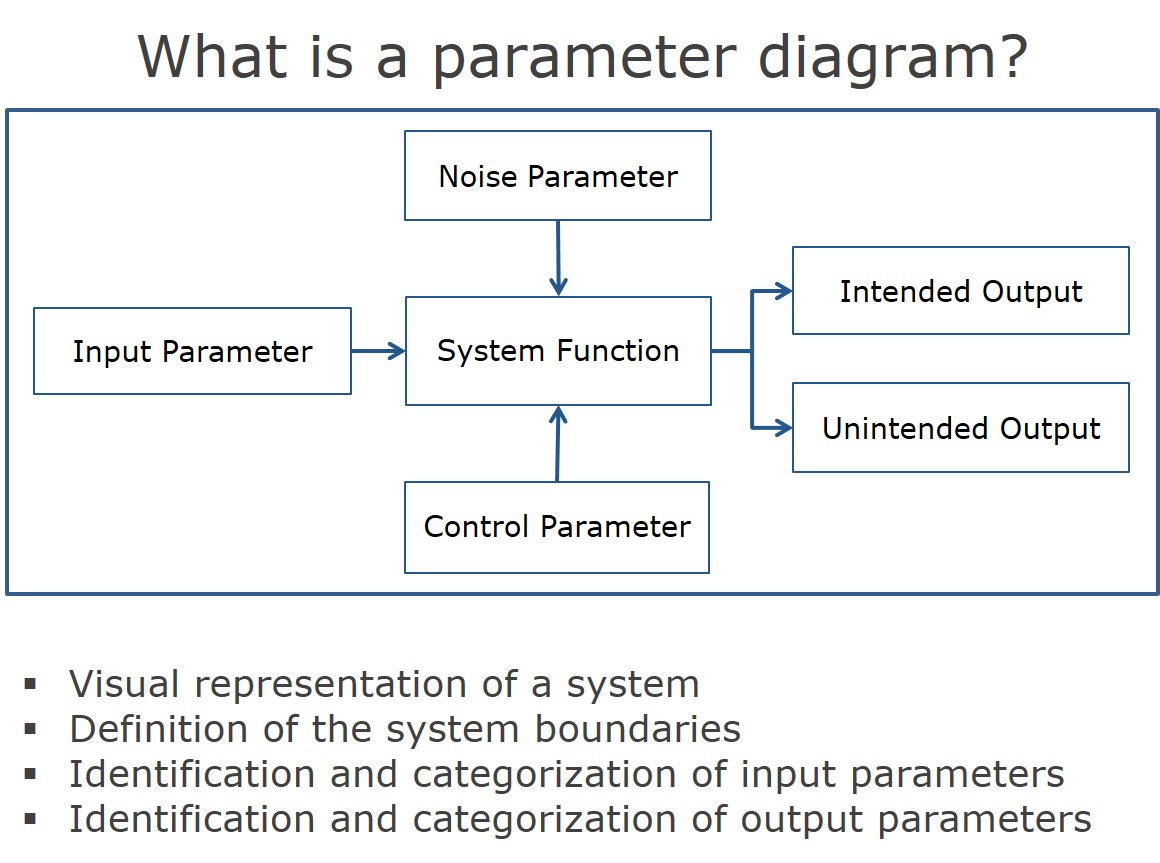
FMEA parameter diagram
It shows:
- The transformation of the inputs into the outputs
- The “noise factors” that affect the system
- The control factors (the development variables)
- The categorization of the outputs into “intended” and “unintended”.
The P diagram thus helps the development team to better understand the physical and functional connections.
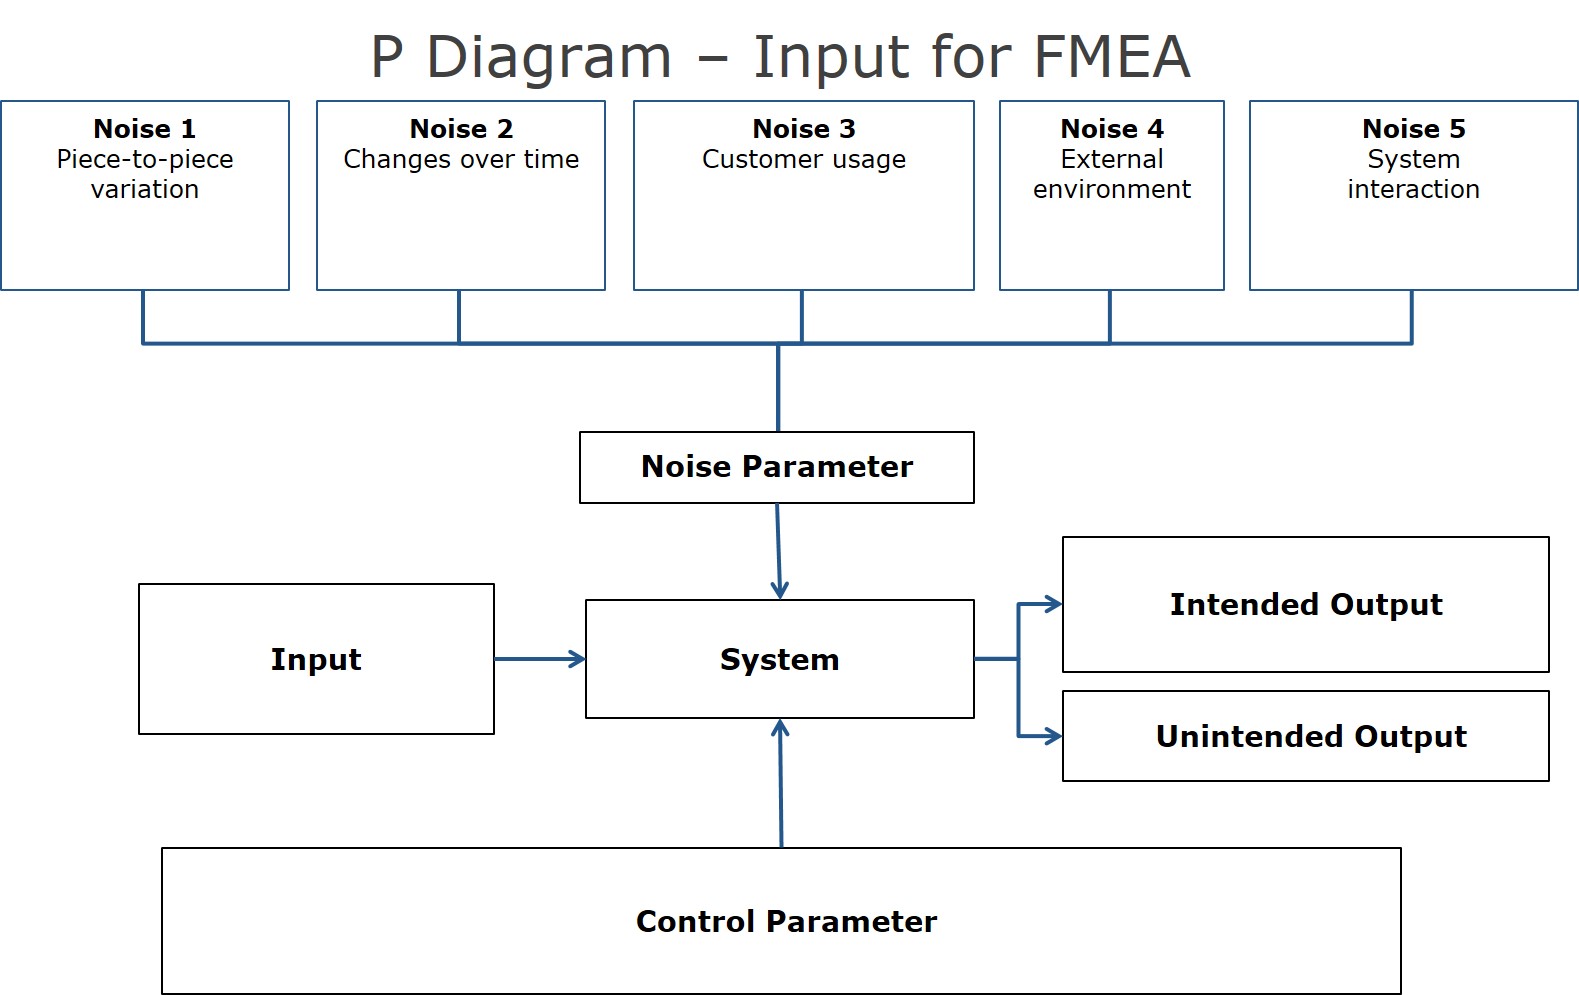
The noise factors can, in turn, be divided into five categories:
- Variation from unit to unit
- Wear/fatigue
- Customer usage
- Environmental effects
- Interactions with corresponding systems
The control factors present the design options available to the development team. The opportunities of achieving the aim of “robust design” are developed here. Robustness here means that the system is insensitive to the noise factors. The findings from the P diagram are integrated into the FMEA.